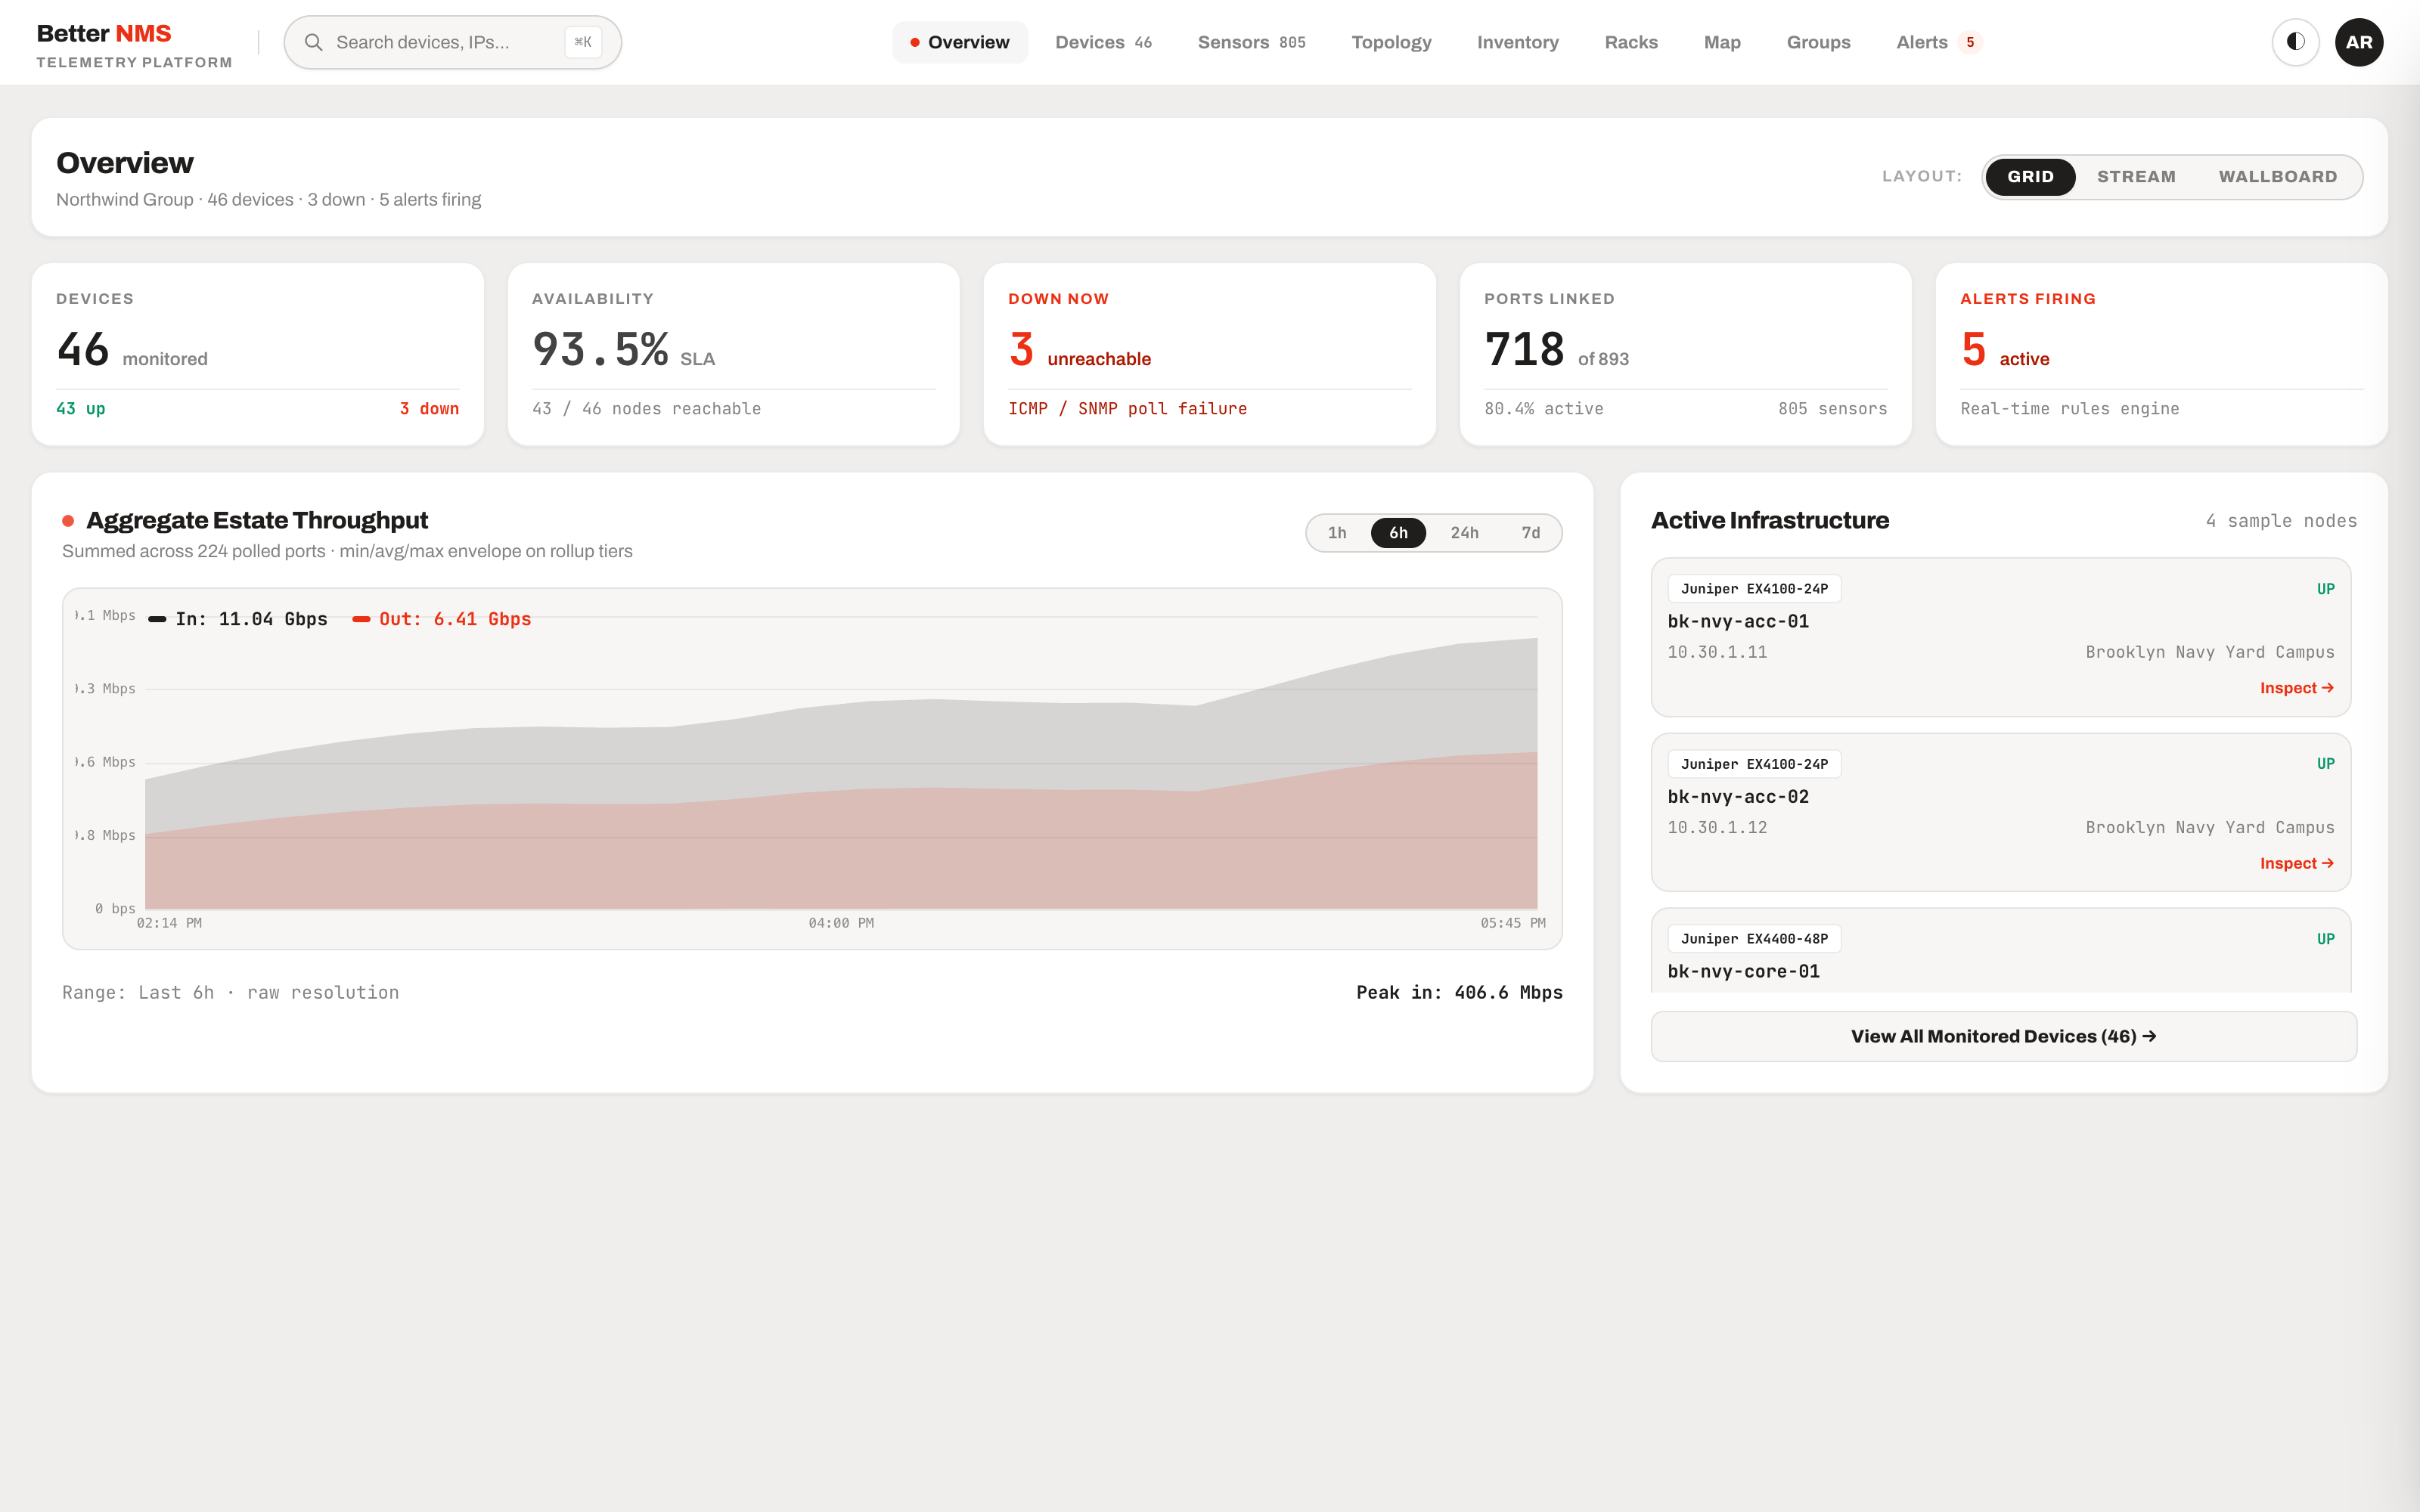
Network consoles should calm an engineer during an outage, not add cognitive overload.
Traditional network management systems like LibreNMS, Zabbix or PRTG are capable, but their operational footprint is substantial: PHP runtimes, Python poller daemons, Redis queues, RRD flat files or heavyweight Windows VMs.
During a critical outage at 3 A.M., engineers don’t need walls of uncalibrated widgets, nested configuration tabs, or interpolated data pretending a silent link is healthy. BetterNMS was designed from scratch as a single Go binary backed by normalized PostgreSQL: honest empty states, instant optical levels, and zero cluster dependencies.
3 A.M. legibility
High-contrast layout organized for engineers under pressure. No micro-graphs or guessing link states.
Zero-queue engine
One compiled Go binary handles SNMP/ICMP polling, topological correlation and API delivery in ~60MB RAM.
Physical DCIM
42U visual rack elevations with to-scale Field Pack PDFs and in-browser CAD/spreadsheet inspection.
Hardware ledger
Tracks networked gear alongside laptops and POS machines with legal PDF handover agreements.
High-frequency telemetry powered by a single binary and partitioned PostgreSQL.
BetterNMS eliminates external message brokers, time-series database daemons and client-side polling agents. Everything runs within a single statically compiled Go runtime.
The poller executes concurrent goroutines for SNMP v2c/v3 walks and ICMP sweeps without latency stalls. 64-bit ifXTable counters are converted in flight to throughput rate graphs (bps/pps), errors, and discards. Metrics stream directly into partitioned PostgreSQL tables with automated 3-tier rollups (5-minute raw, hourly, and daily aggregates). Standard psql is a first-class querying interface.
Technology stack
- Go (Golang)
- PostgreSQL
- Nuxt 3
- TypeScript
- SNMP v2c/v3
- ICMP Telemetry
- SFP Optical DDM
- Canvas / SVG
- Docker
- Air-Gapped Appliance
Bridging the gap between network ports and physical datacenter reality.
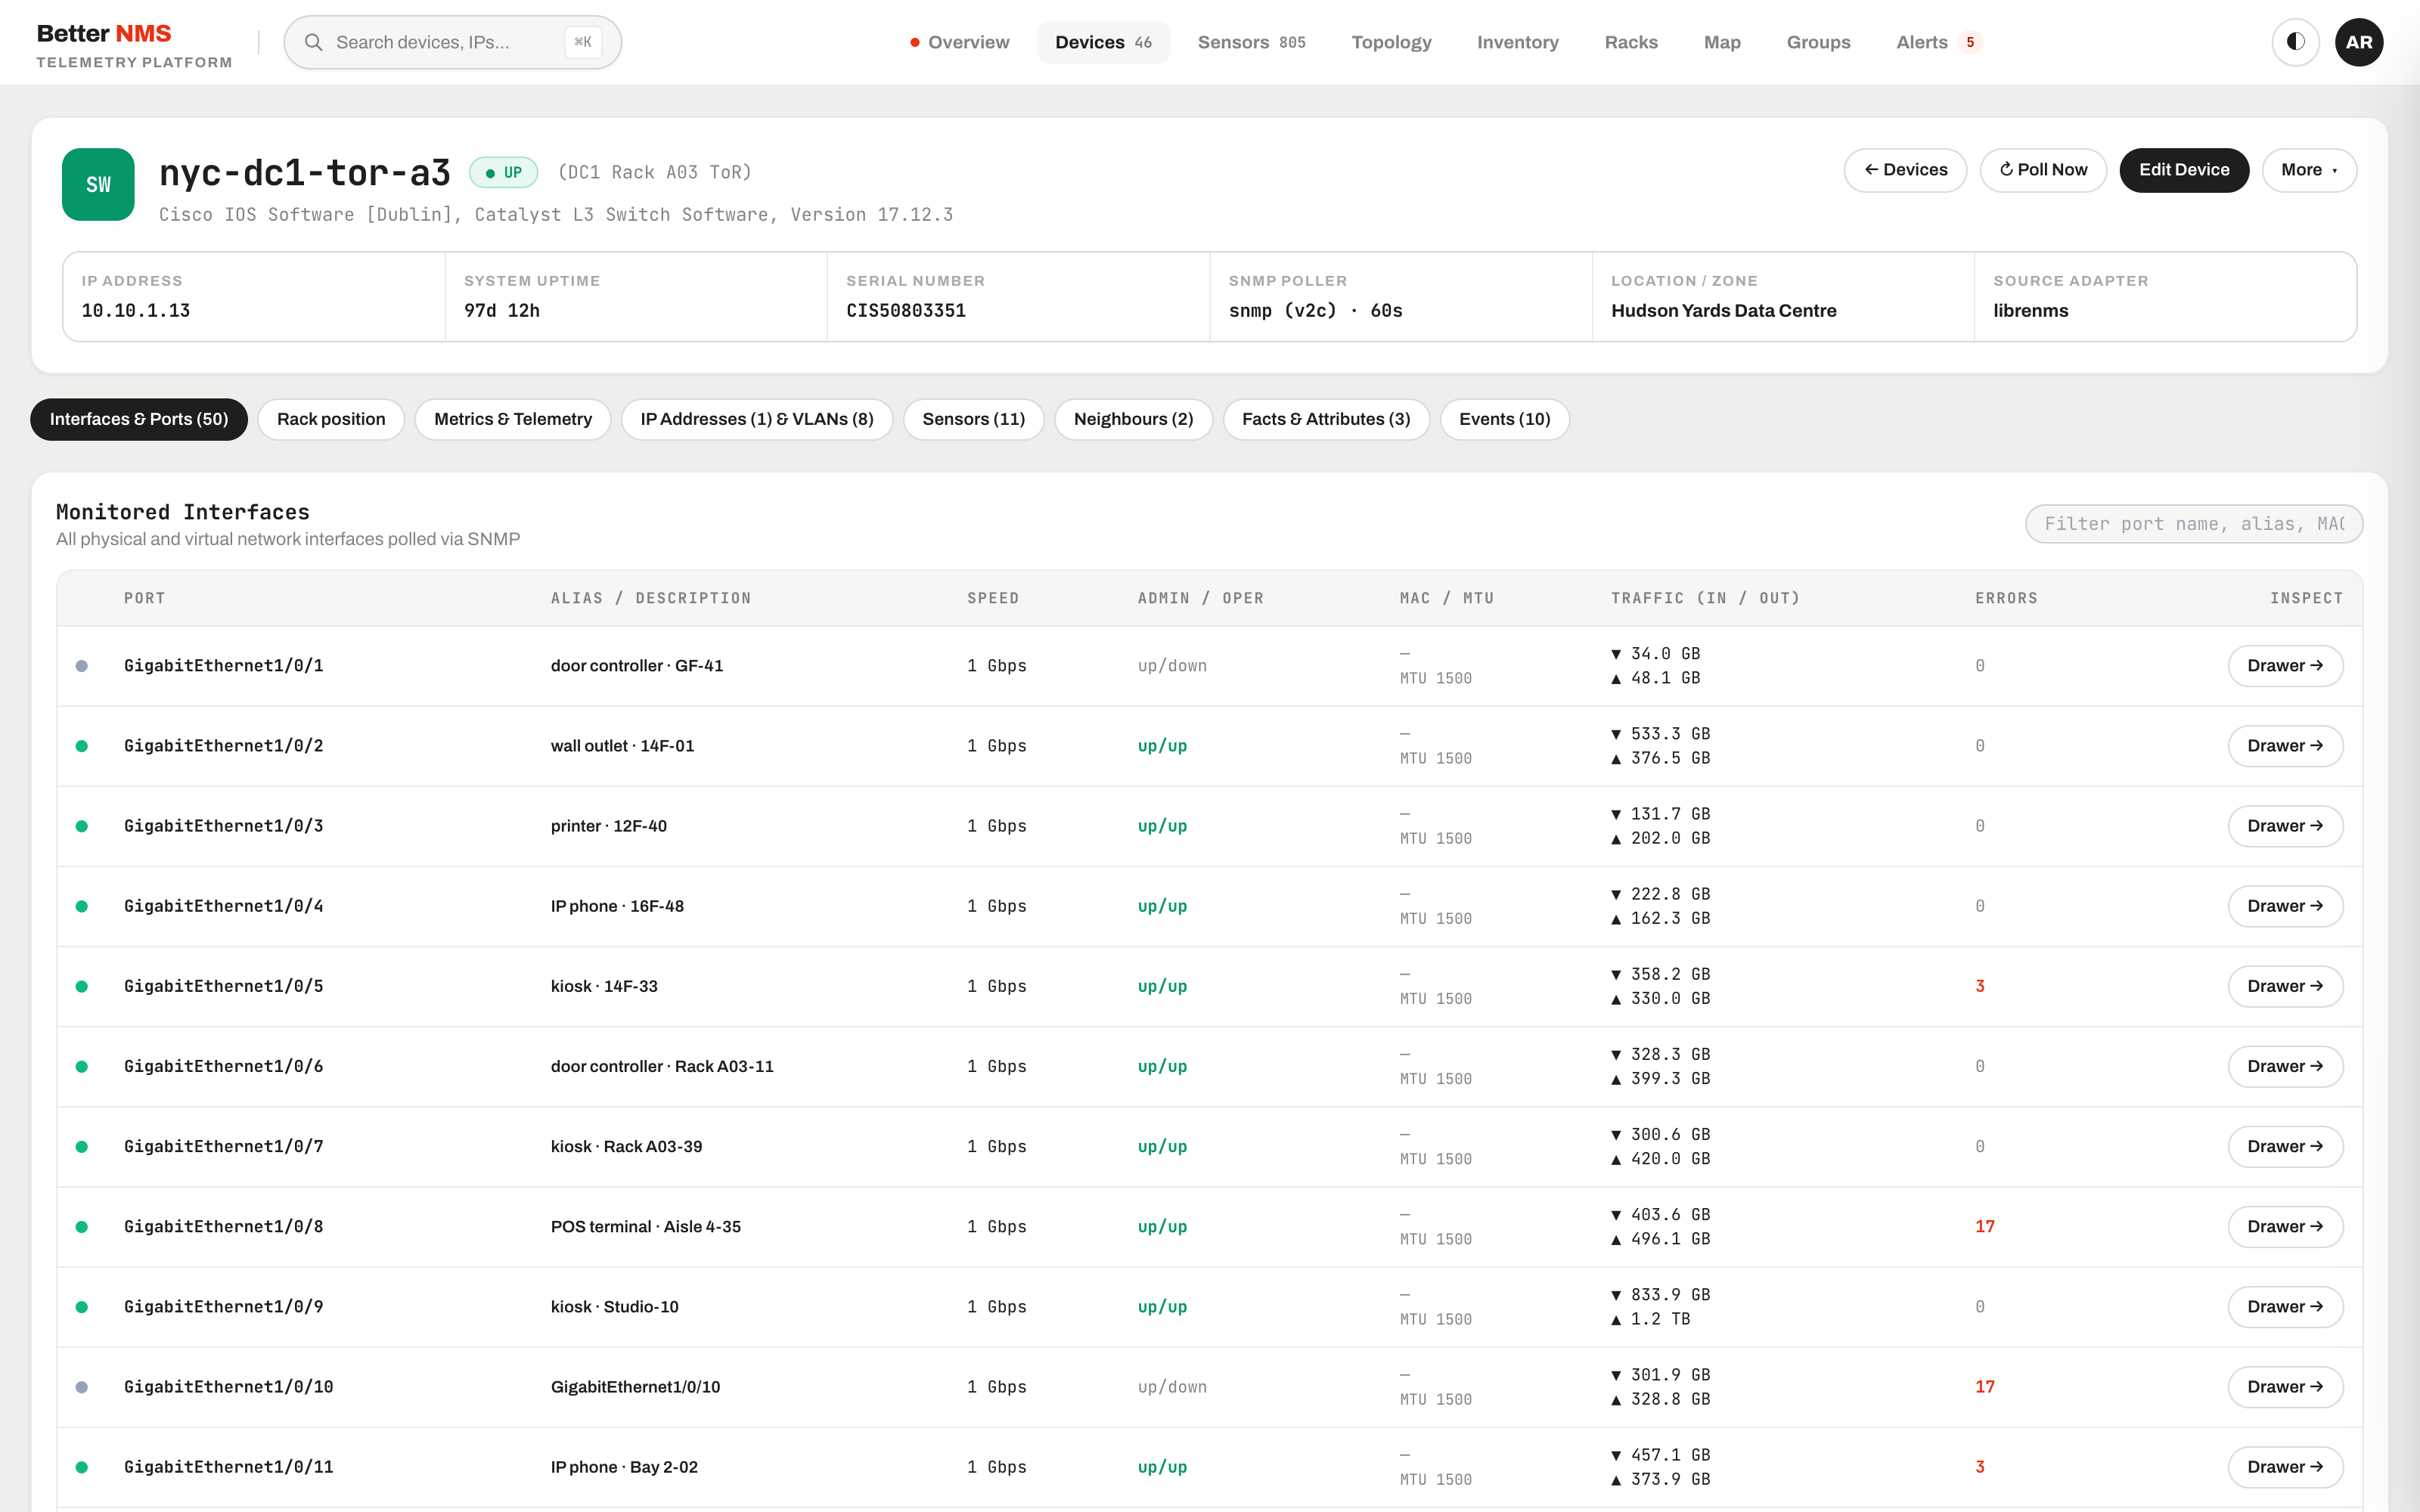
Network topology does not live in a vacuum; it lives in racks, patches, floors, and offices. BetterNMS combines digital port metrics with physical DCIM and complete hardware custody.
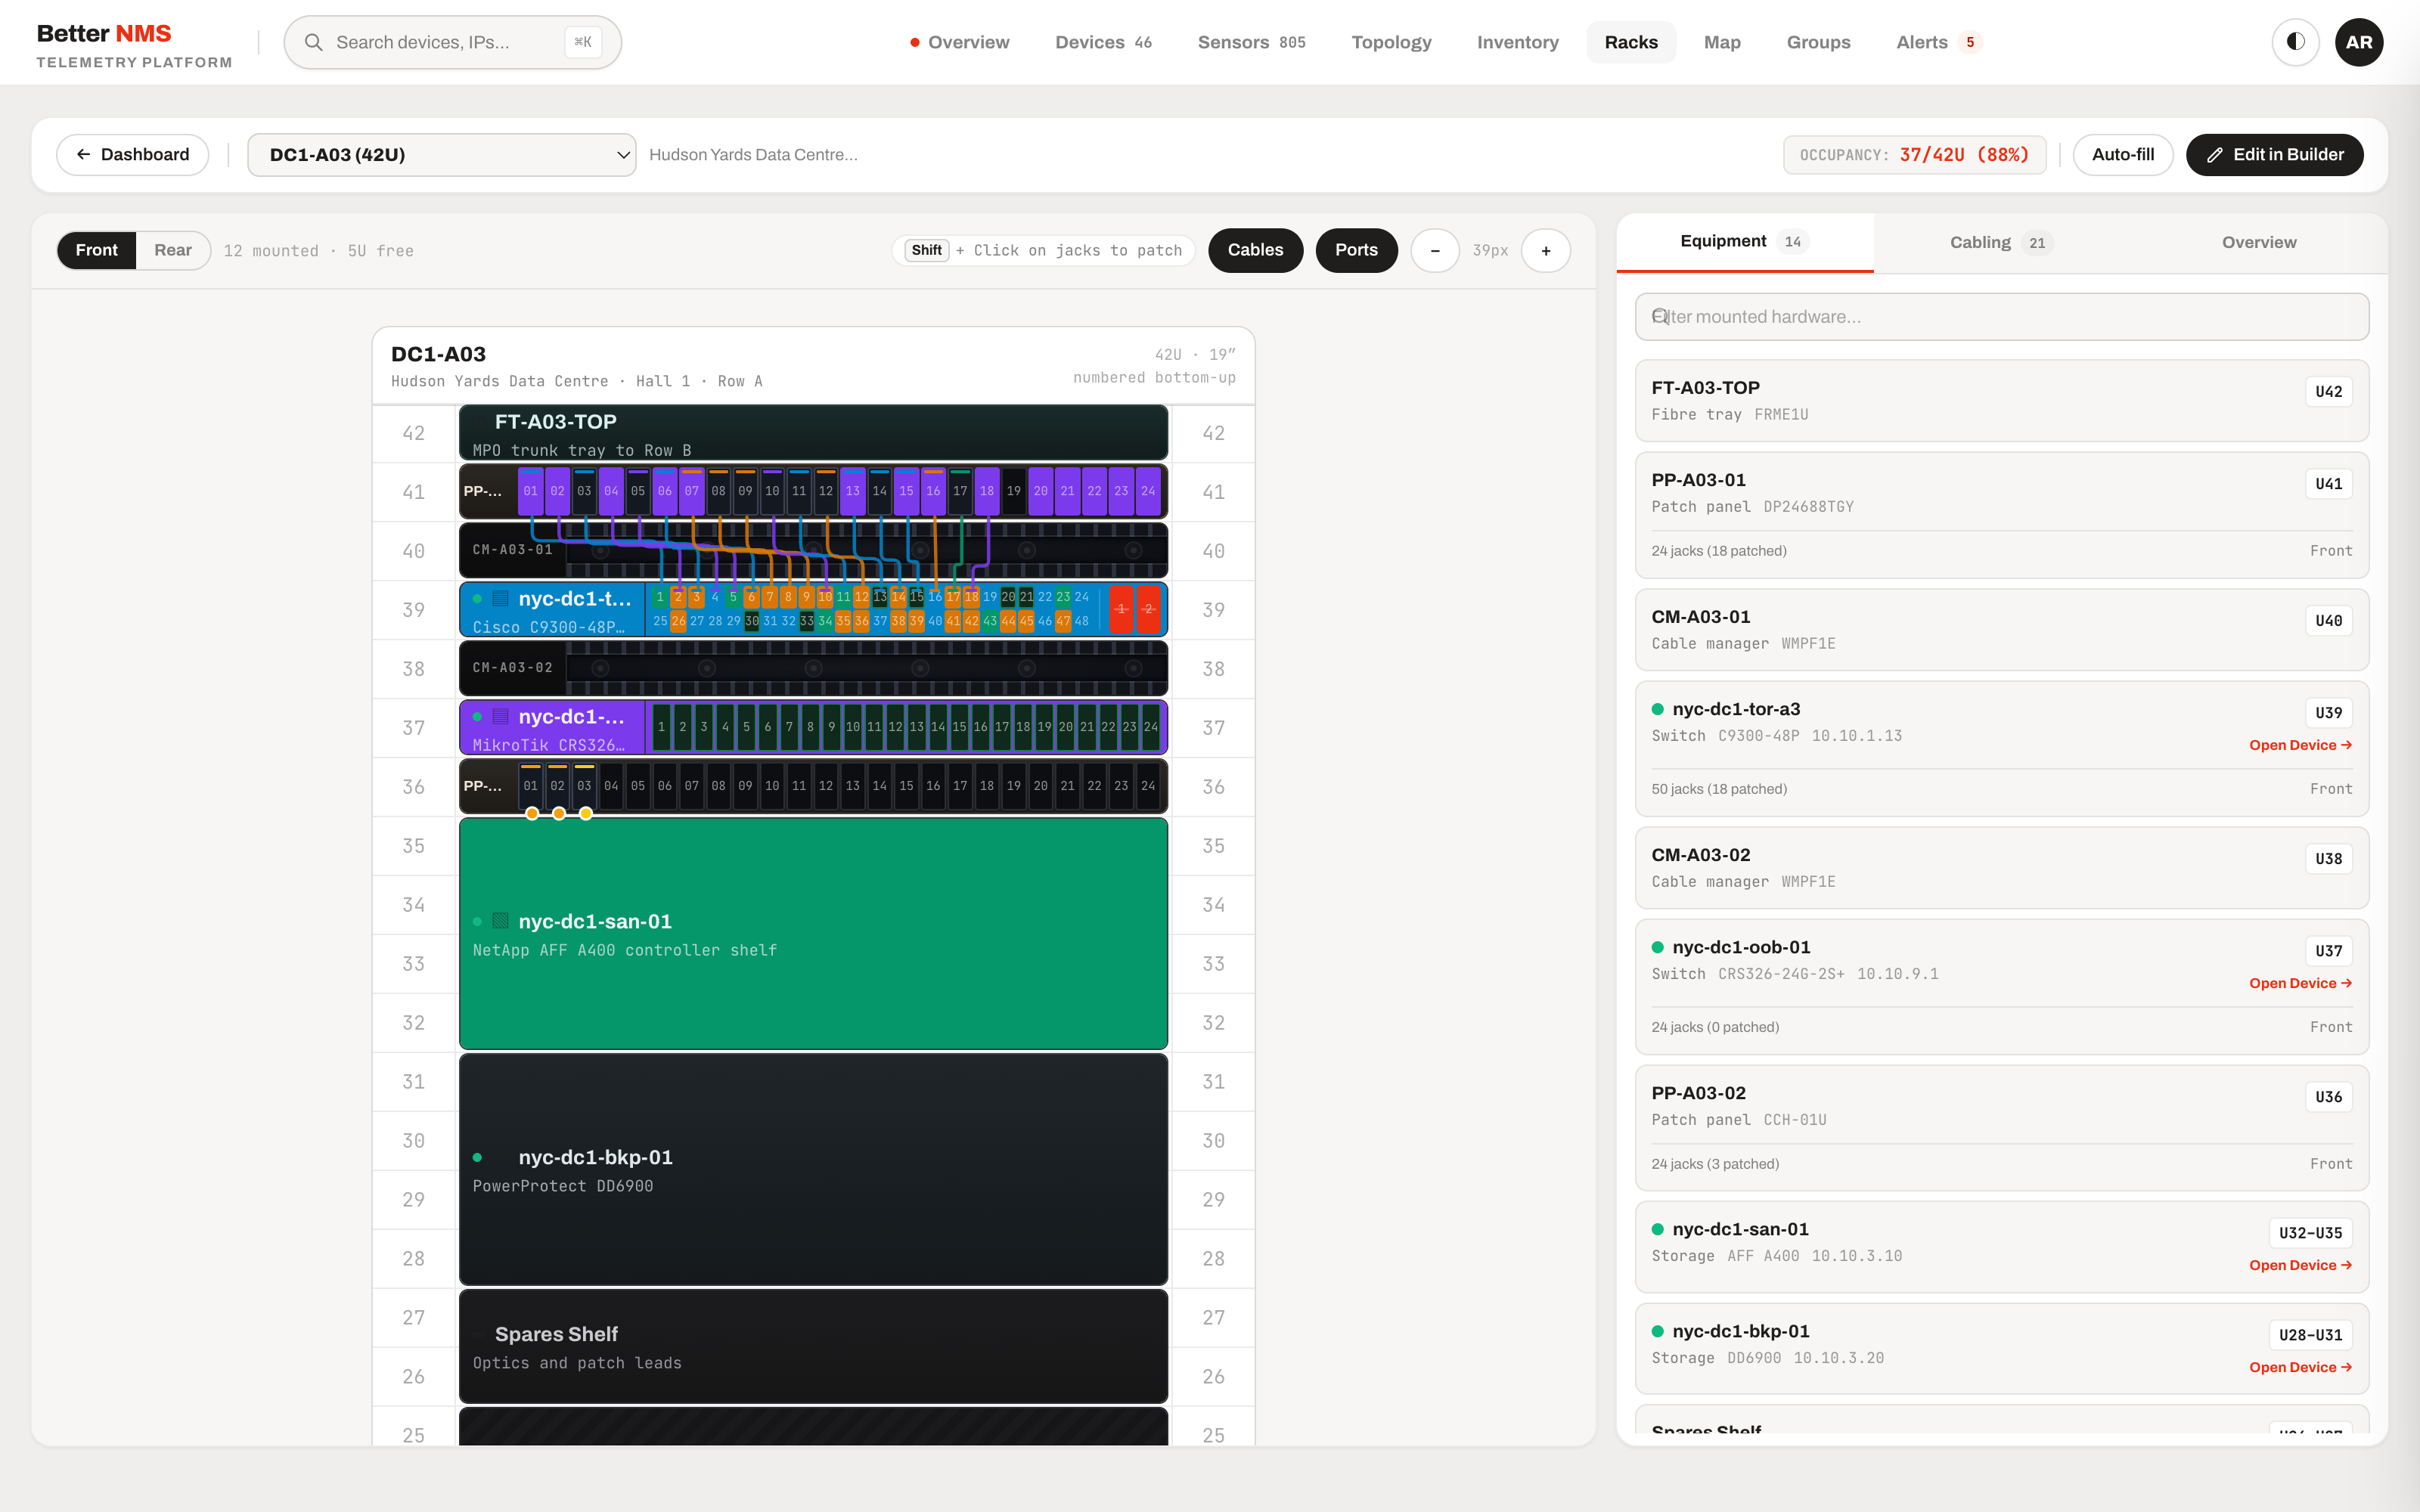
Datacenter teams can manage unit-by-unit 42U rack elevations with front/rear rail mounting, cage split, structured patch cabling, and printable to-scale Field Pack PDFs for field technicians. In-browser document viewers render attached CAD drawings, fiber OTDR reports, photos, PDFs, and .xlsx spreadsheets directly on the cabinet page with content-addressed storage.
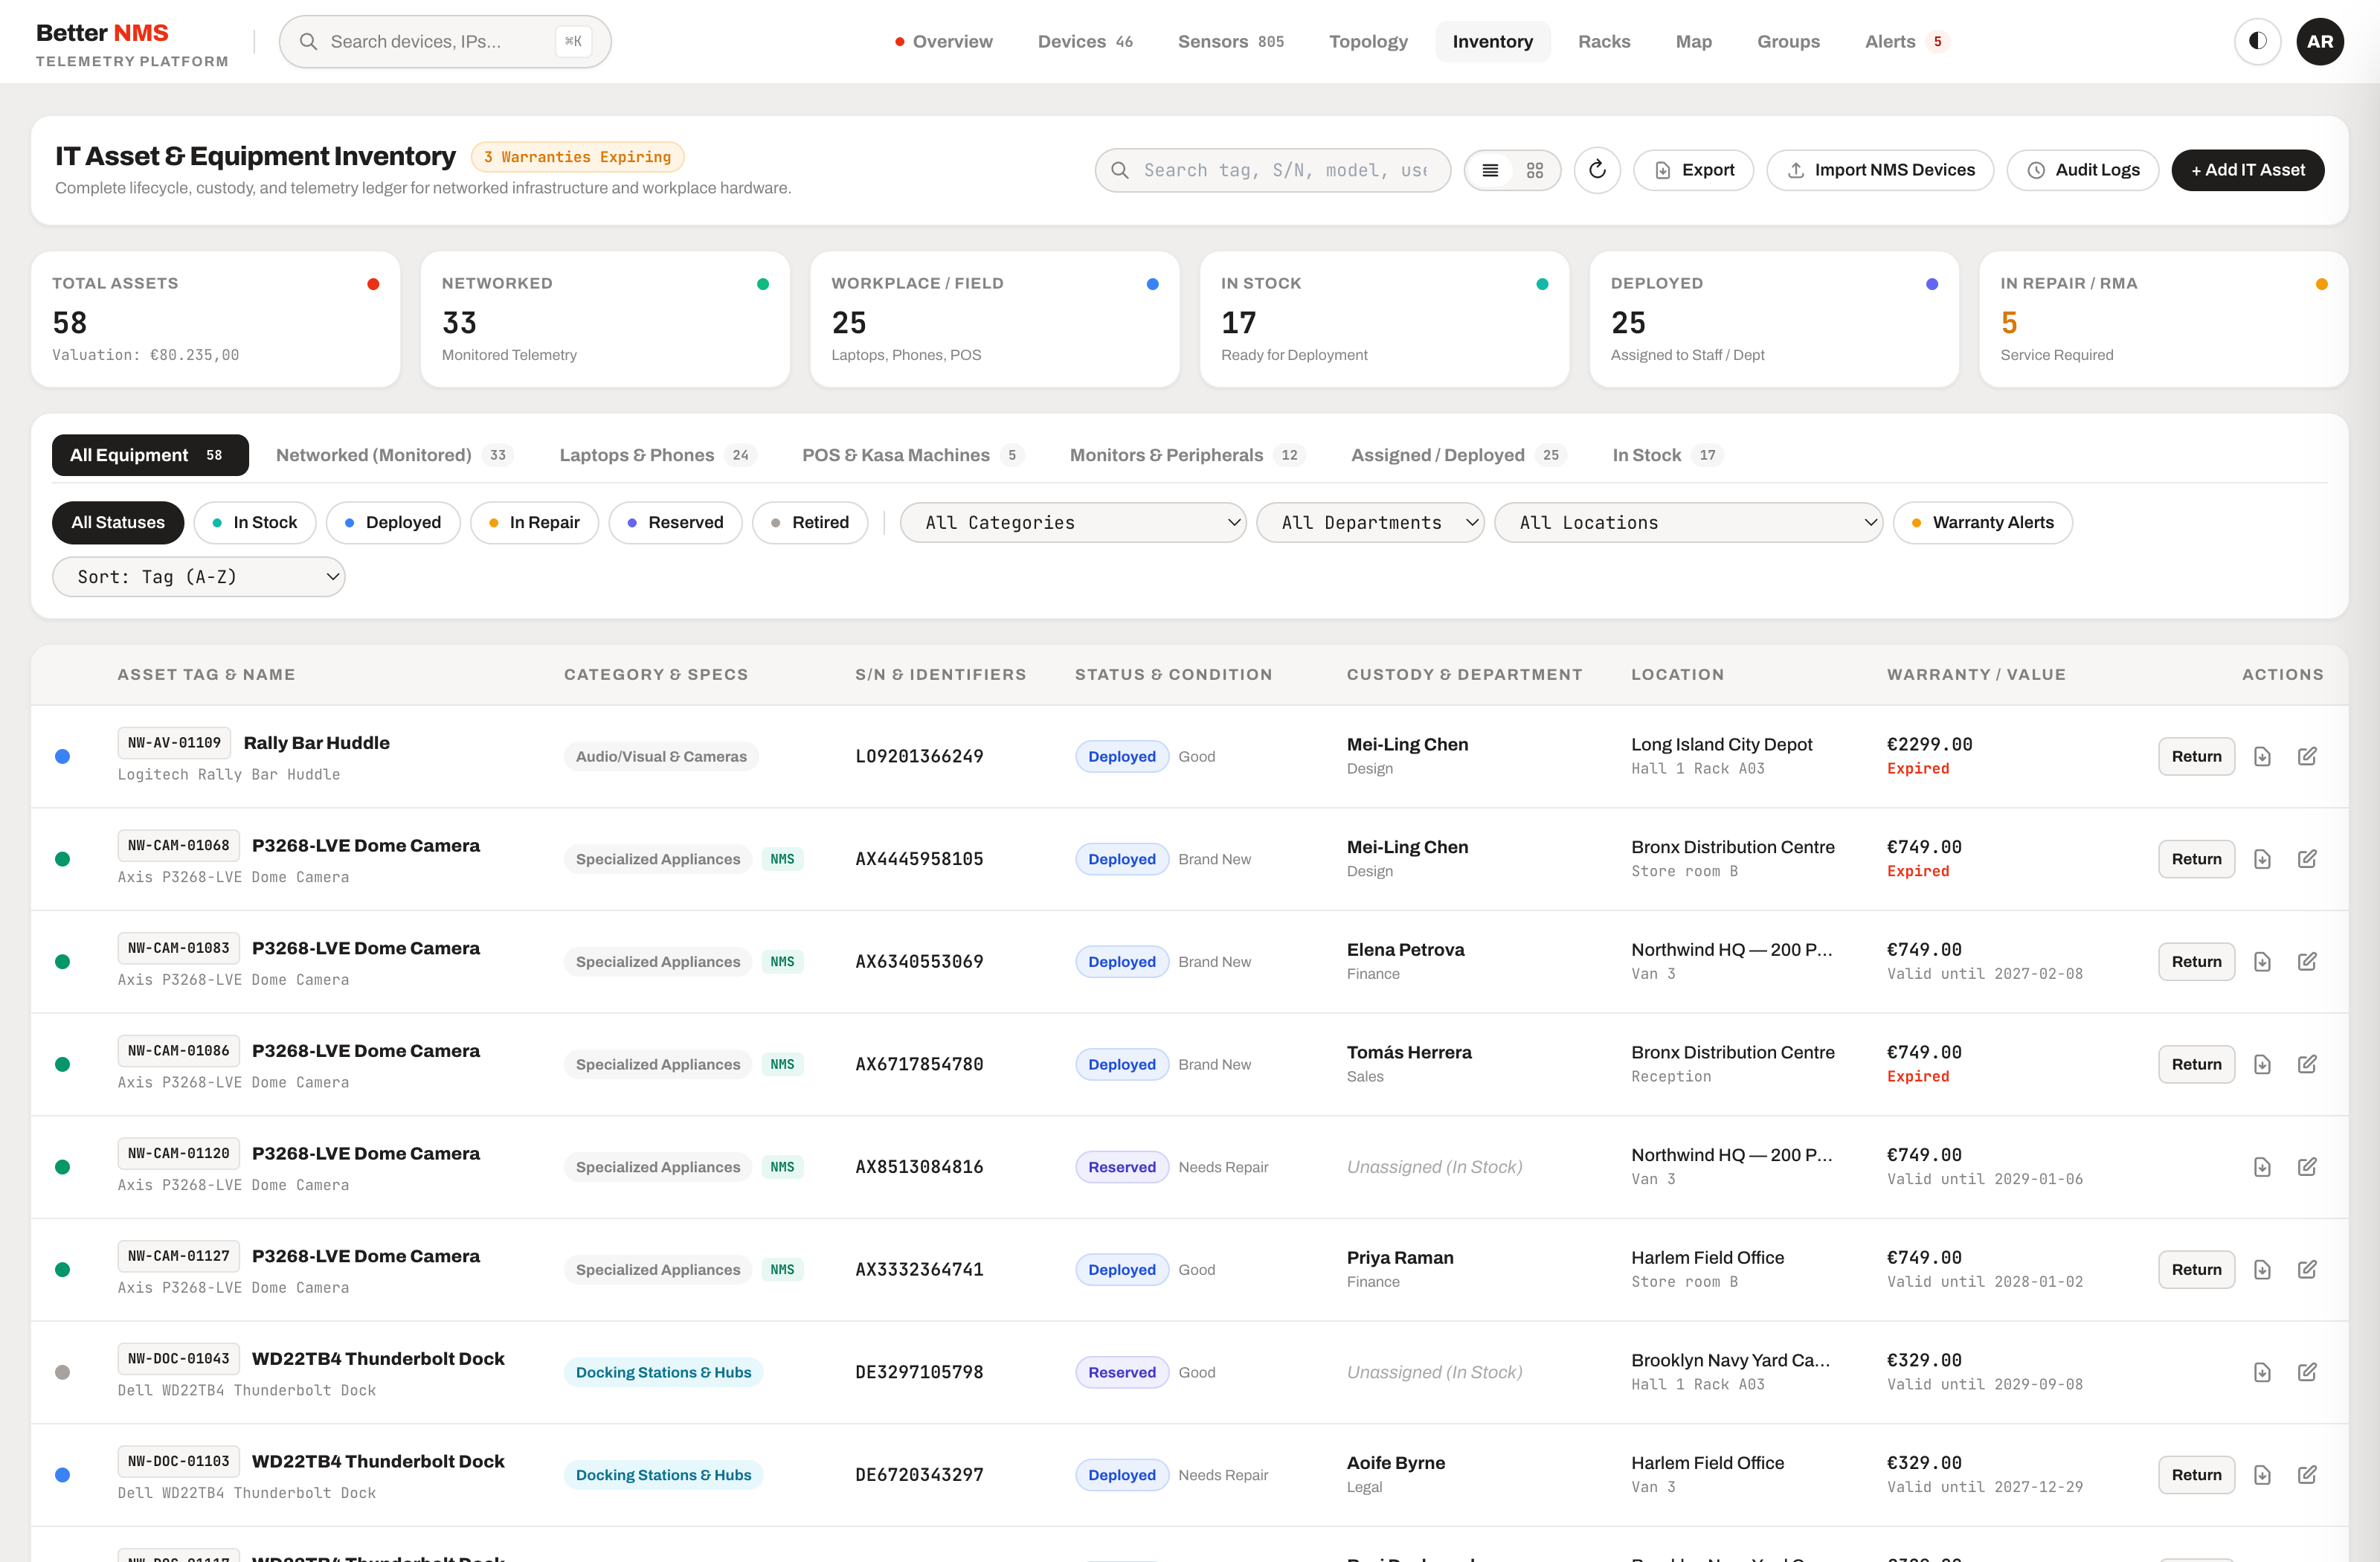
Alongside core networking gear, a full IT asset lifecycle ledger registers non-networked hardware—laptops, MacBooks, phones, POS terminals, and barcode scanners. It tracks custody, EUR financial valuation, warranty lifespans, and generates executive Legal Handover Agreement PDFs with dual signature lines and accessories checklists.
Honest empty states
Panels without data say so clearly. Numbers are never guessed or interpolated during a partial outage.
Hop-based attribution
Correlates cascading downstream failures back to root devices using discovered LLDP topology.
Zero-gap maintenance
Maintenance windows mute alerts without stopping metric collection, preserving trend histories.
Content-addressed storage
Attached spreadsheets and photos are stored securely on disk with strict MIME allowlists and zero script risk.
Root-cause incident correlation and dedicated NOC wallboard displays.
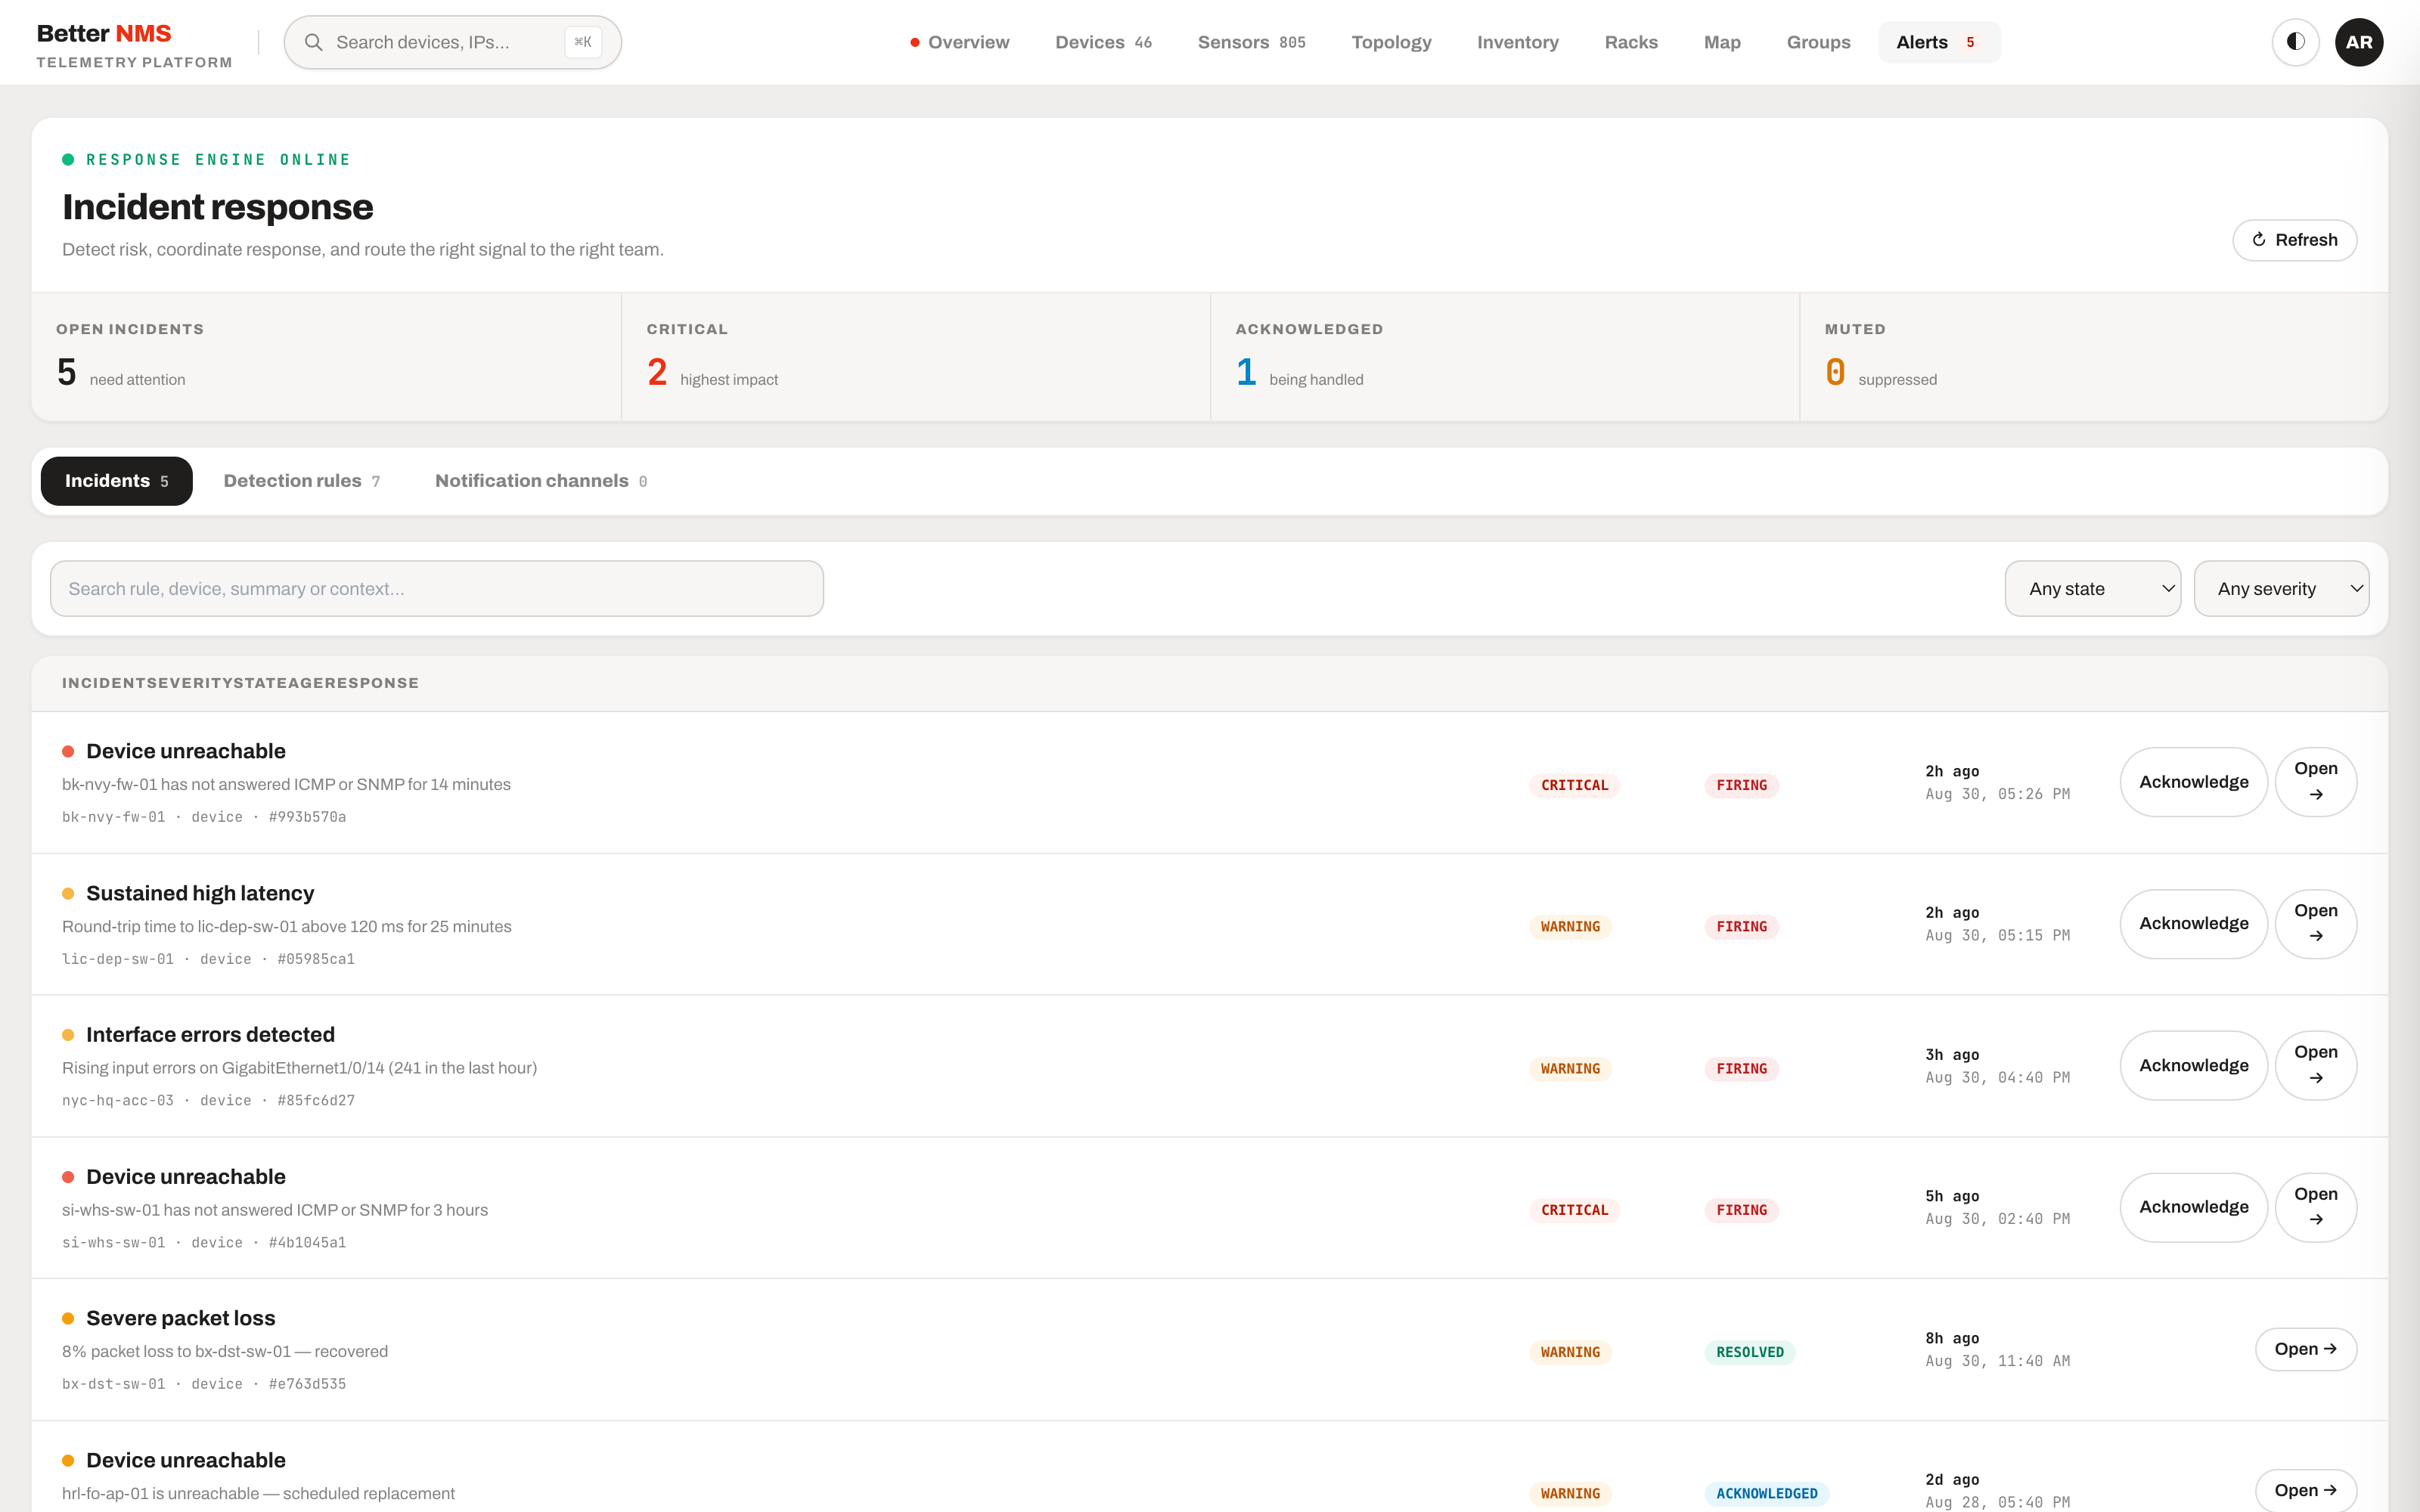
When a distribution switch drops, engineers shouldn't drown under hundreds of secondary alert notifications. BetterNMS clusters cascading alarms into a single root-cause incident.
Downstream alerts are grouped with clear topological context (e.g. behind core-sw-01 (2 hops)), allowing operators to acknowledge the entire outage cluster with a single click. For control rooms and 4K displays, a dedicated NOC Wallboard system offers 12 modular widgets—from dense reachability matrices to regional geographic cluster maps and optical environmental tracking.
Single-node capacity
Tested on 691+ devices, 10,200 ports, and 10,800 sensors on a single node in ~60MB RAM.
100% self-hosted & secure
Air-gapped deployment, 1-click LibreNMS importer, and 6-role RBAC across 10 security domains.